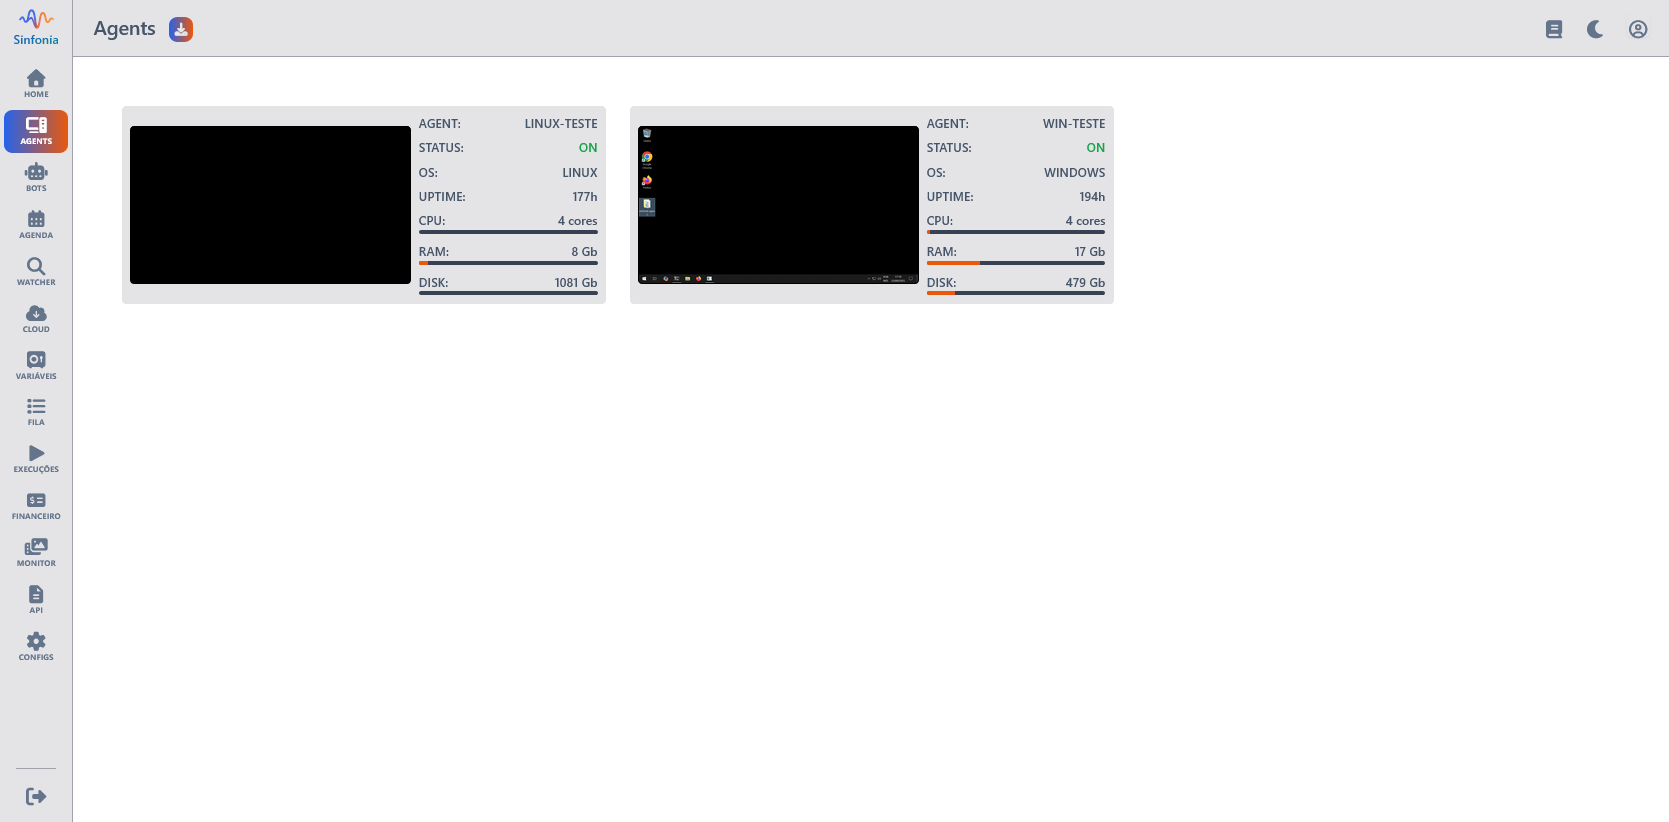
Agents
This component allows managing and monitoring agents connected to the system. You can view status, performance metrics, access real-time logs, and also deploy the agent on the server.
Deploy
Access the page https://sinfonia.live/agents and identify the download icon in the upper left corner.
Download
Follow the instructions below to download the Sinfonia agent.
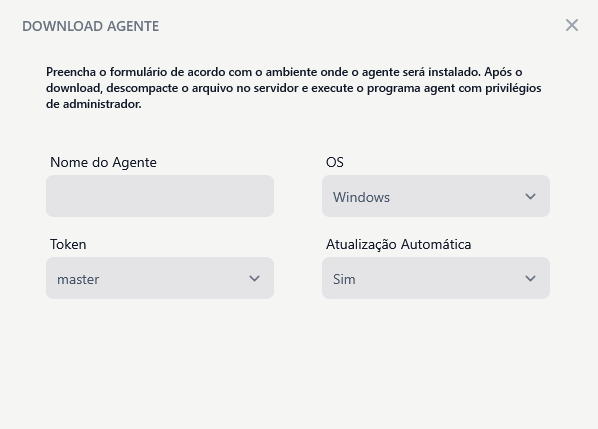
Agent Name
- Description: Name that will be assigned to the agent for identification in the system.
OS
- Description: Operating system where the agent will run.
- Available options:
Linux,Windows.
Token
- Description: Authentication token generated for the agent. This token is used to ensure security and communication between the agent and the server.
- How to obtain: The token can be generated on the Sinfonia platform, in the tokens section.
- Note: By default, the platform generates a
mastertoken when configuring your tenant.
Auto Update
- Description: Defines whether the agent should automatically update to new versions when available.
- Available options:
Enabled,Disabled.
Warning
After downloading, upload the files to the server where the agent will run.
Windows Execution
Simply run the agent.exe file to start the agent execution.
Linux Execution
Create folder
mkdir /home/@user/sinfonia
cd /home/@user/sinfonia
Change file permission
chmod +x /home/@user/sinfonia/agentRun in background
nohup ./opt/sinfonia/agent &Agent Monitoring
Each agent is displayed in an individual panel with the following data:
| Field | Description |
|---|---|
| Name | Agent identifier (e.g., LINUX TEST, WIN TEST). |
| Status | Indicates whether the agent is ONLINE or OFFLINE. |
| Uptime | Activity time since the agent’s last startup. |
| CPU | Current CPU usage percentage. |
| RAM | Current RAM memory usage percentage. |
| DISK | Current disk usage percentage. |
| Preview | Desktop environment thumbnail image of the agent (if available). |
Live
The interface presents a real-time monitoring panel. The screen is divided into two main sections: the screenshot viewing area on the left and the logs panel on the right.
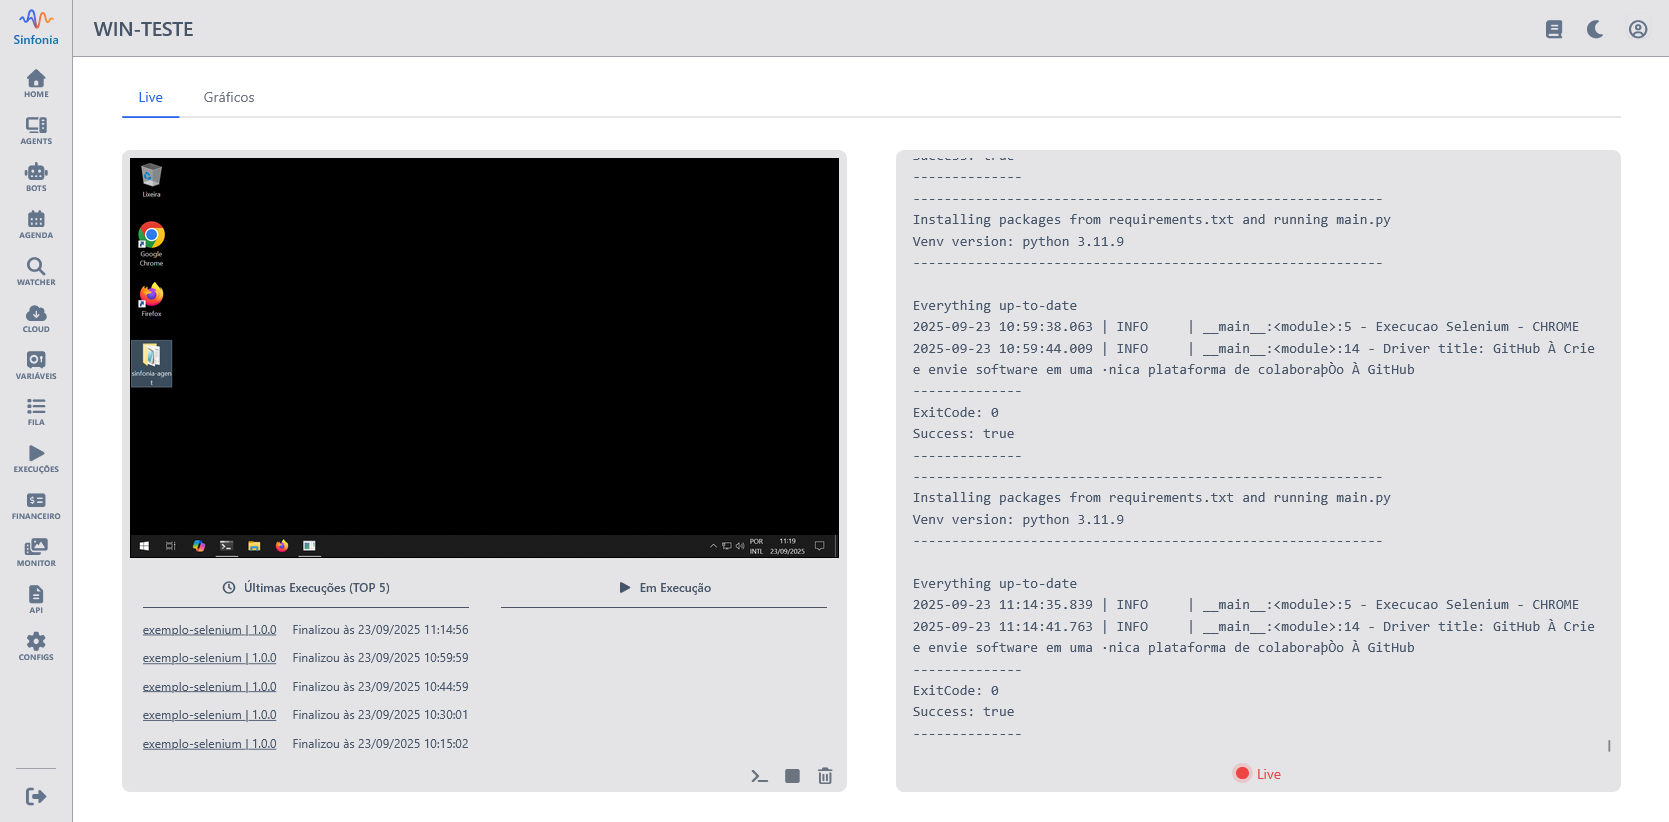
Screenshot Viewing Area
Latest Executions
Displays a list of the latest executions performed. Each item in the list includes:
- Robot Name: Identifies the robot that was executed.
- Timestamp: Indicates the date and time of execution.
Currently Running
Shows robots that are currently executing. Each item includes:
- Robot Name: Identifies the running robot.
- Timestamp: Indicates the date and time of execution start.
Logs Panel
Use this panel to track all logs generated by robots in real time.
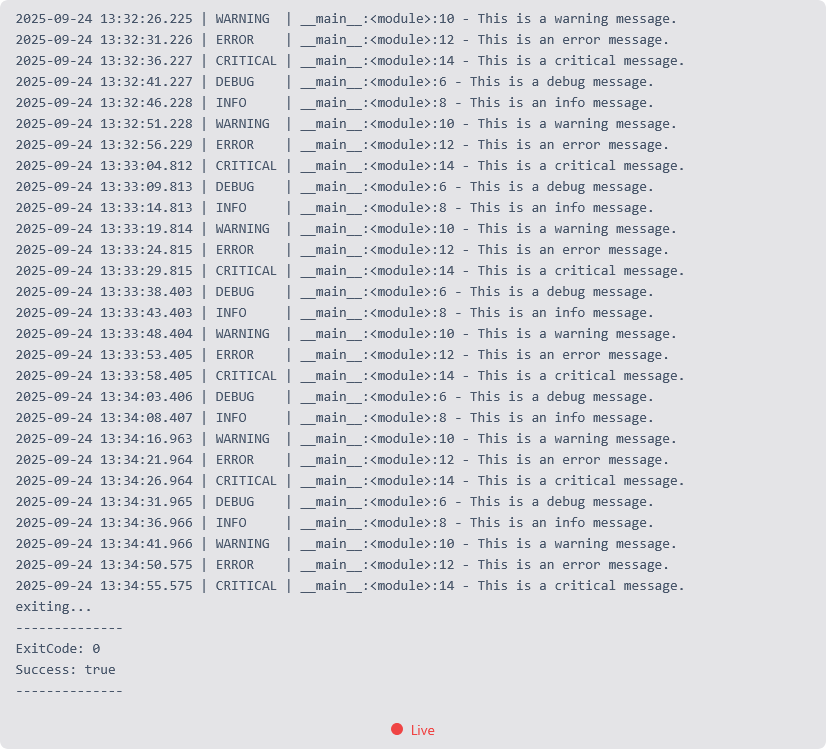
Note
Hover over the logs panel to disable auto-scroll and be able to navigate the text.
Charts
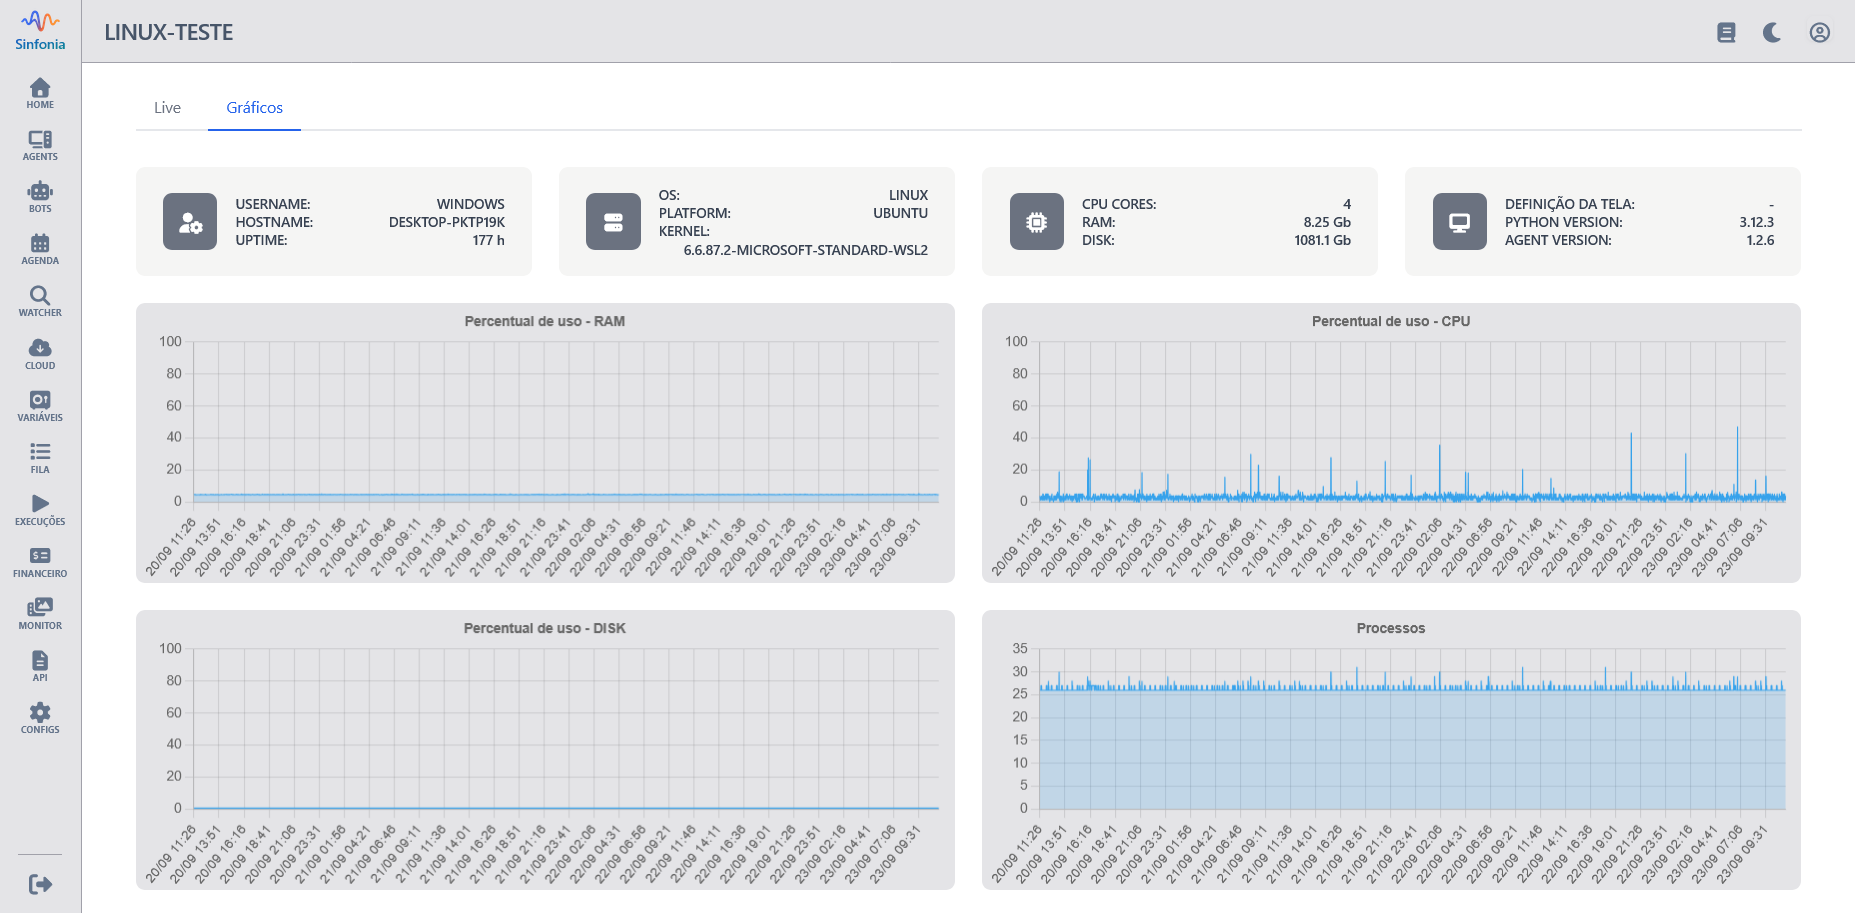
At the top of the screen, detailed data about the connected agent is displayed:
- Username: Name of the user running the agent.
- Hostname: Host name of the system where the agent is running.
- Uptime: Total time the agent has been active since the last restart.
- OS: Operating system of the environment where the agent is installed.
- Platform: System architecture (e.g., x86_64, arm64).
- Kernel: Operating system kernel version.
- CPU Cores: Number of CPU cores available in the system.
- Total RAM: Total amount of RAM memory available in the system.
- Total DISK: Total disk storage capacity of the system.
- Screen Resolution: Current screen resolution of the agent (e.g., 1920x1080).
- Python Version: Python version installed in the agent environment.
- Agent Version: Version of the agent software running.
At the bottom, agent performance metrics are displayed, including:
- CPU Percentage: Current CPU usage.
- RAM Percentage: Current RAM memory usage.
- DISK Percentage: Current disk usage.
- Active Processes: Number of currently active processes.