Dashboard
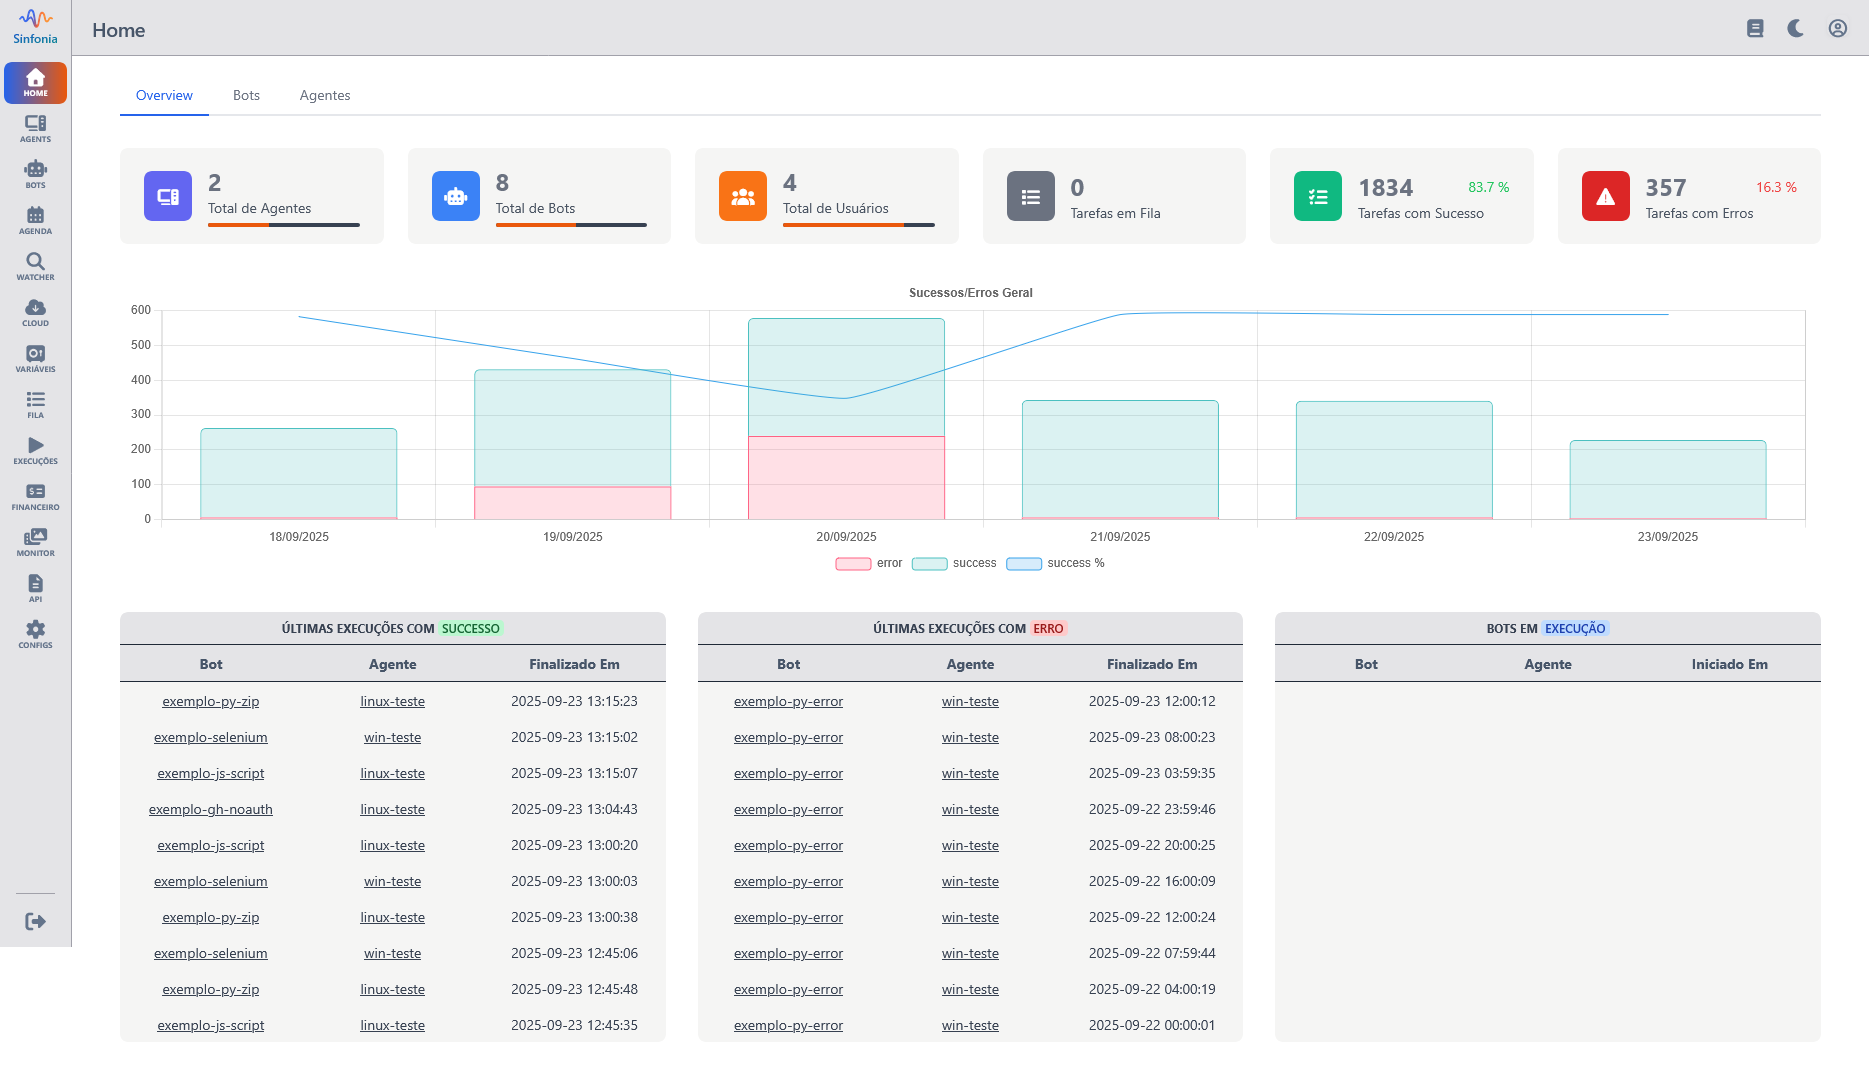
The dashboard Home screen is the central point for monitoring bot and agent activities. It offers a consolidated view of operational metrics, recent executions, and real-time status.
Navigation
The interface has three main tabs:
- Overview: Displays global metrics and performance charts.
- Bots: Displays global metrics about registered bot execution.
- Agents: Displays global metrics about registered agents.
The Overview tab is selected by default when accessing the dashboard.
Main Metrics
At the top of the screen, six key indicators are displayed:
| Metric | Description |
|---|---|
Total Agents | Number of active agents in the system |
Total Bots | Total number of registered bots |
Total Users | Users registered in the tenant |
Tasks in Queue | Pending execution tasks |
Successful Tasks | Total tasks completed successfully |
Failed Tasks | Total tasks that failed |
Success/Error Chart
The General Success/Errors section presents a combined chart:
- Bars: Represent the number of successful and failed tasks in each time interval.
- Line: Indicates the general execution trend.
This chart is useful for identifying patterns, failure spikes, or improvements over time.
Latest Successful Executions
Lists the most recent executions that were completed successfully. Each entry includes:
- Bot name
- Responsible agent
- Completion date and time
Latest Failed Executions
Displays executions that failed recently. Each record contains:
- Bot name
- Involved agent
- Error date and time
This section is essential for quick diagnosis and error correction.
Running Bots
Shows bots that are currently executing, with the following data:
- Bot name
- Executing agent
- Task start time
Usage Recommendations
- Access this screen daily to monitor bot performance.
- Prioritize error analysis to ensure process stability.
- Use success data to identify good practices and replicate them.
- Monitor running bots to avoid agent overload.